Why to use an on-chip debugger ?
You have certainly already used a debuger to find a bug in a program running on your computer. You may want to do the same with your embedded device. Personnally, I really prefer to work without any IDE, so I will present you a solution to use on-chip debug directly into your terminal through command line.
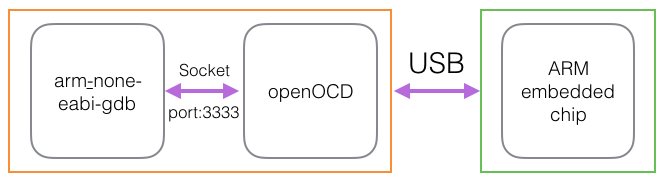
How is it possible ?
I think a schema is more clear than a long fastidious explanation
Needed tools
You will need :
- openOCD
- gcc-arm-embedded
Installation
On OS X
I recommand you to use Homebrew
Thanks to brew to will juste have to run :
brew update
brew cask install Caskroom/cask/gcc-arm-embedded
echo 'export PATH=$PATH:/usr/local/Caskroom/gcc-arm-embedded/5_2-2015q4,20151219/gcc-arm-none-eabi-5_2-2015q4/bin' >> ~/.bashrc
or
echo 'export PATH=$PATH:/usr/local/Caskroom/gcc-arm-embedded/5_2-2015q4,20151219/gcc-arm-none-eabi-5_2-2015q4/bin' >> ~/.zshrc
brew install openocd
NOTE: Replace 5_2-2015q4 and 20151219 with the current version you downloaded.
and test next commands to unsure a perfect installation
arm-none-eabi-gcc --version
openocd --version
On linux
sudo apt-get update
sudo apt-get install gcc-arm-none-eabi
sudo apt-get install openocd
and test next commands to unsure success installation
arm-none-eabi-gcc --version
openocd --version
NOTE : Don’t forget to add the arm and openocd binaries file to your path HELP : If gcc-arm-embedded not available on you linux, download it here
Get Started
You should have 2 terminal windows opened.
On terminal 1
We will launch the openOCD server to make the bridge between the ARM on-board-chip and the debugger on your computer.
To do it, juste type :
openocd -f path/to/the/config_board_file.cfg
Then openOCD is controling the hardware, your should be ready to use gdb in the terminal 2.
Example: For OS X users the path should be (for version 0.9.0 of openOCD) : /usr/local/Cellar/open-ocd/0.9.0/share/openocd/scripts/board/name_of_your_borad.cfg Example: For Linux users the path should be (for version 0.9.0 of openOCD) : /usr/share/openocd/scripts/board/name_of_your_borad.cfg
BUG[1]
In some case, with some hardware boards you could have the following error :
Warn : Cannot communicate... target not halted.
Error: auto_probe failed
Error: Connect failed. Consider setting up a gdb-attach event for the target to prepare target for GDB connect, or use 'gdb_memory_map disable'.
Error: attempted 'gdb' connection rejected
In order to fixe these issues you should add these following lines into your board configuration file (.cfg), into the script/target/name_of_your_board_or_board_familly.cfg file :
$_TARGETNAME configure -event gdb-attach {
	halt
}
$_TARGETNAME configure -event gdb-attach {
	reset init
}
Example : For the FRDM-KL25z board from NXP, you should modify the file :
/usr/local/Cellar/open-ocd/0.9.0/share/openocd/scripts/target/klx.cfgfor OS X users and/usr/share/openocd/scripts/target/klx.cfgfor Linux users.
On terminal 2
I recommand you to create once for all a file named “.gdbinit” where you have your ‘program.elf’.
In this file, put these 3 lines :
target remote :3333
monitor reset halt
b path_to/main.c:main()
Thanks to the 3 lines:
- Gdb will be connected to openOCD through the port 3333.
- The ‘monitor’ command is to send openOCD specific command to the openOCD server. Here we will ask openOCD to reset and to halt before the first line of code that will be executed.
- The third line is to add a breakpoint to the fist line of your main.c
Then run :
arm-none-eabi-gdb program.elf
Here it is, you are debugging your code running into your embedded micro-processor.
NOTE: If you don’t know how to generate the .elf, take a look to this post which gives an example of a makefile which can generate all output formats for embedded processor.
How to use the debugger
I will do another tutorial to deal with gdb.
Sources
This tutorial was inspired by this video
Footnotes:
-
1: This bug was resolved thanks to mcuoneclipse ↩